Initializing particles in LAMTA#
Tutorial to initialize particles for advection.
The Diagnostics.ParticleSet class creates an object containing:
the velocity field
the initial particle positions
the mode and advection method options
Diagnostics.ParticleSet is a child class of Lagrangian.
It therefore inherits all methods and properties from the
Lagrangian class (see Lagrangian.ipynb).
Particle initialisation methods#
Particles can be initialised using three different class methods:
from_input#
Particles are initialised by directly providing (x, y, t)
positions and times for individual particles.
from_grid#
Particles are seeded on a regular grid defined by:
(x, y)spatial limitsdelta0(horizontal grid step)
Particles are initialised for each time between dayv
(date 'YYYY-mm-dd') and dayv ± numdays.
from_disk#
Particles are initialised inside a disk defined by:
a centre
(pxc, pyc)a radius (in degrees of longitude/latitude)
Particles can be sampled:
along concentric circles from the centre to the maximum radius
(sample='circle')randomly inside the disk
(sample='random')
Three examples are provided for each class method.
Import librairies
from lamta.Diagnostics import ParticleSet, Lagrangian
from lamta.Load_nc import loadCMEMSuv
import matplotlib.pyplot as plt
import numpy as np
import datetime as dt

import cartopy.crs as ccrs
import cartopy.feature as cfeature
Load Ocean field
from pathlib import Path

from lamta_examples.data_fetch import ensure_dataset
from lamta.Load_nc import loadCMEMSuv

DATA_DIR = Path(
    ensure_dataset("altimetry_nrt_global_20220909-20220929.tar.gz")
)

rep = str(DATA_DIR / "altimetry" / "nrt_global") + "/"

all_days = ['20220919','20220920','20220921','20220922','20220923','20220924','20220925','20220926','20220927','20220928','20220929']
varn = {'longitude':'longitude','latitude':'latitude','u':'ugos','v':'vgos'}
field = loadCMEMSuv(all_days,rep,varn,unit='deg/d')
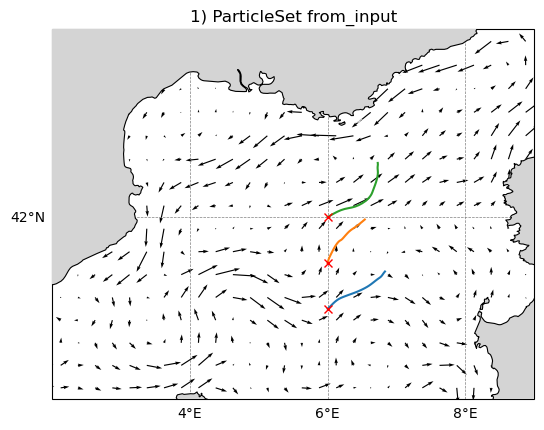
########## 1) Individual positions: from_input
# (x,y) positions
px = np.array([6,6,6])
py = np.array([41,41.5,42])
# time (days)
dayv = '2022-09-19'
numdays = 10
day1 = dt.datetime.strptime(dayv,'%Y-%m-%d').date()
day1j = dt.datetime.toordinal(day1)
pt = np.array([day1j,day1j+numdays]) # forward time
numstep = 30

pset = ParticleSet.from_input(pt,px,py,fieldset=field) #forward

#compute trajectories
trjf = pset.rk4flat(Lagrangian.interpf,numstep,coordinates='spherical')
import numpy as np
import matplotlib.pyplot as plt

import cartopy.crs as ccrs
import cartopy.feature as cfeature
from cartopy.mpl.gridliner import LONGITUDE_FORMATTER, LATITUDE_FORMATTER
from matplotlib.ticker import MultipleLocator

lat = np.asarray(field["lat"])
lon = np.asarray(field["lon"])
Y, X = np.meshgrid(lat, lon)   # shapes: (nlon, nlat)  EXACTLY like your Basemap line

u0 = np.asarray(field["u"][0, :, :])
v0 = np.asarray(field["v"][0, :, :])

if u0.shape != X.shape:
    if u0.T.shape == X.shape:
        u0 = u0.T
        v0 = v0.T
    else:
        raise ValueError(f"Cannot align u/v with grid: X/Y={X.shape}, u0={u0.shape}")

fig = plt.figure()
ax = plt.axes(projection=ccrs.Mercator())
ax.set_extent([2, 9, 40, 44], crs=ccrs.PlateCarree())

ax.add_feature(cfeature.LAND, facecolor="0.83", edgecolor="none", zorder=100)
ax.add_feature(cfeature.COASTLINE, linewidth=0.8, zorder=101)

gl = ax.gridlines(crs=ccrs.PlateCarree(), draw_labels=True, linewidth=0.5, linestyle="--", color="0.5")
gl.top_labels = False
gl.right_labels = False
gl.xformatter = LONGITUDE_FORMATTER
gl.yformatter = LATITUDE_FORMATTER
gl.xlocator = MultipleLocator(2)
gl.ylocator = MultipleLocator(2)

skip = 1
ax.quiver(
    X[::skip, ::skip], Y[::skip, ::skip],
    u0[::skip, ::skip], v0[::skip, ::skip],
    transform=ccrs.PlateCarree(),
    scale=5,
    color="k",
    zorder=1,
)

trjx = np.asarray(trjf["trjx"])
trjy = np.asarray(trjf["trjy"])

ntime = len(trjf["trjx"]) if isinstance(trjf["trjx"], (list, tuple)) else None
if trjx.ndim == 2 and ntime is not None:
    if trjx.shape[0] != ntime and trjx.shape[1] == ntime:
        trjx = trjx.T
        trjy = trjy.T

good = np.isfinite(trjx) & np.isfinite(trjy)
trjx = np.where(good, trjx, np.nan)
trjy = np.where(good, trjy, np.nan)

ax.plot(trjx, trjy, transform=ccrs.PlateCarree(), zorder=102)
ax.plot(trjx[0, :], trjy[0, :], "rx", transform=ccrs.PlateCarree(), zorder=103)

plt.title("1) ParticleSet from_input")
plt.show()
c:\Users\lloyd\miniforge3\envs\lamta_examples\Lib\site-packages\shapely\creation.py:218: RuntimeWarning: invalid value encountered in linestrings
  return lib.linestrings(coords, np.intc(handle_nan), out=out, **kwargs)
c:\Users\lloyd\miniforge3\envs\lamta_examples\Lib\site-packages\shapely\creation.py:218: RuntimeWarning: invalid value encountered in linestrings
  return lib.linestrings(coords, np.intc(handle_nan), out=out, **kwargs)
c:\Users\lloyd\miniforge3\envs\lamta_examples\Lib\site-packages\shapely\creation.py:218: RuntimeWarning: invalid value encountered in linestrings
  return lib.linestrings(coords, np.intc(handle_nan), out=out, **kwargs)
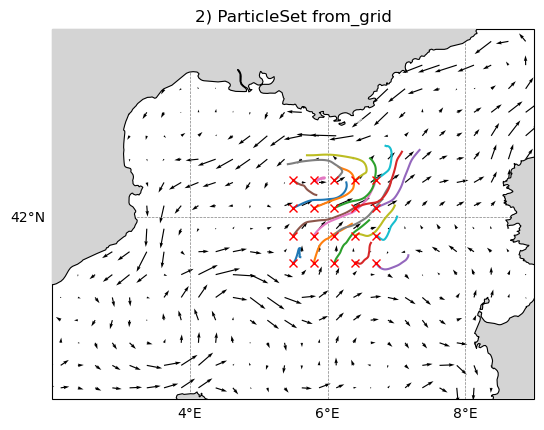
########## 2) Positions on regular grid: from_grid
# (x,y) positions
loni = [5.5,7] # x limits
lati = [41.5,42.5] # y limits
delta0 = 0.3 # horizontal step in degree
# time
dayv = '2022-09-19'
numdays = 10
numstep = 4
psetg = ParticleSet.from_grid(numdays,loni,lati,delta0,dayv,fieldset=field,mode='forward')

#compute trajectories
trjfg = psetg.rk4flat(Lagrangian.interpf,numstep,coordinates='spherical')
import numpy as np
import matplotlib.pyplot as plt

import cartopy.crs as ccrs
import cartopy.feature as cfeature
from cartopy.mpl.gridliner import LONGITUDE_FORMATTER, LATITUDE_FORMATTER
from matplotlib.ticker import MultipleLocator

fig = plt.figure()
ax = plt.axes(projection=ccrs.Mercator())
ax.set_extent([2, 9, 40, 44], crs=ccrs.PlateCarree())

ax.add_feature(cfeature.LAND, facecolor="0.83", edgecolor="none", zorder=100)
ax.add_feature(cfeature.COASTLINE, linewidth=0.8, zorder=101)

gl = ax.gridlines(crs=ccrs.PlateCarree(), draw_labels=True, linewidth=0.5, linestyle="--", color="0.5")
gl.top_labels = False
gl.right_labels = False
gl.xformatter = LONGITUDE_FORMATTER
gl.yformatter = LATITUDE_FORMATTER
gl.xlocator = MultipleLocator(2)
gl.ylocator = MultipleLocator(2)

skip = 1  # set >1 if you want fewer arrows
ax.quiver(
    X[::skip, ::skip], Y[::skip, ::skip],
    u0[::skip, ::skip], v0[::skip, ::skip],
    transform=ccrs.PlateCarree(),
    scale=5,
    color="k",
    zorder=1,
)

# --- Trajectories from_grid (trjfg) ---
trjx = np.asarray(trjfg["trjx"])
trjy = np.asarray(trjfg["trjy"])

# Force (ntime, ntraj) to avoid “fan”
ntime = len(trjfg["trjx"]) if isinstance(trjfg["trjx"], (list, tuple)) else None
if trjx.ndim == 2 and ntime is not None:
    if trjx.shape[0] != ntime and trjx.shape[1] == ntime:
        trjx = trjx.T
        trjy = trjy.T

# Break lines at NaNs
good = np.isfinite(trjx) & np.isfinite(trjy)
trjx = np.where(good, trjx, np.nan)
trjy = np.where(good, trjy, np.nan)

ax.plot(trjx, trjy, transform=ccrs.PlateCarree(), zorder=102)
ax.plot(trjx[0, :], trjy[0, :], "rx", transform=ccrs.PlateCarree(), zorder=103)

plt.title("2) ParticleSet from_grid")
plt.show()
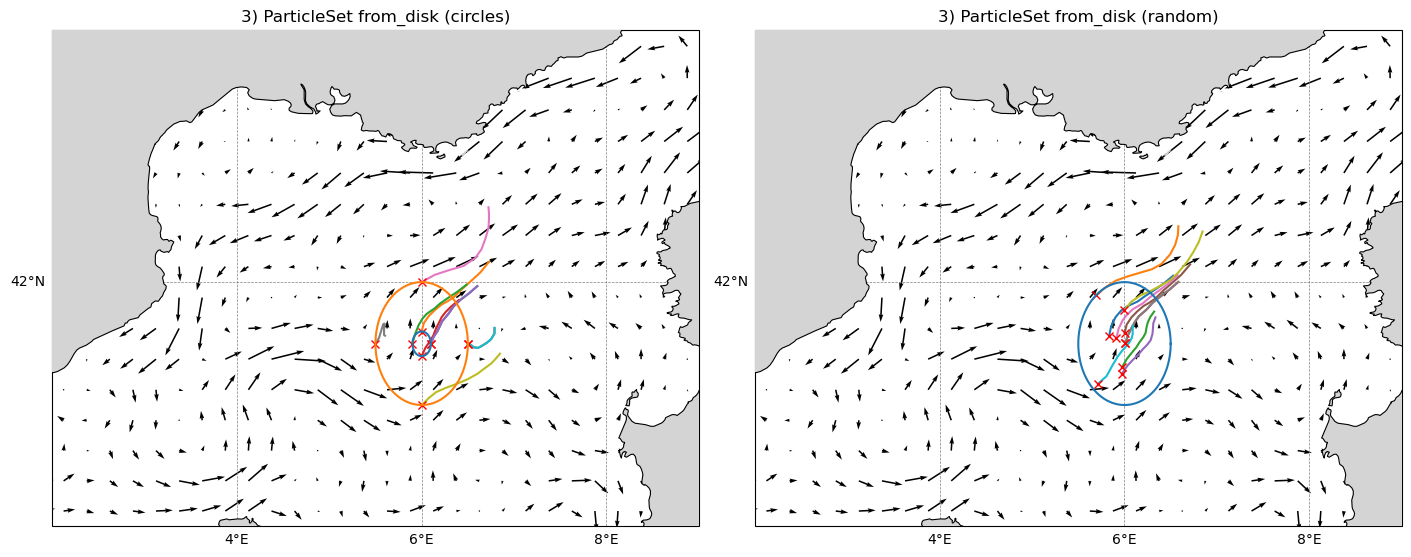
########## 3) Positions on disk: from_disk
# (x,y) positions
lonc = 6 # x center
latc = 41.5 # y center
rad = 0.5 # radius in degree
# time
dayv = '2022-09-19'
numdays = 10
numstep = 10

## sampling along circles
# Argument "deltar" defines the number of circles along which particles are set.
# If not defined default value is 10.
# Argument "npoints" defines the number of particle on each circle (default is 100).
psetdc = ParticleSet.from_disk(numdays,lonc,latc,rad,dayv,
                              sample='circles',fieldset=field,mode='forward',
                               deltar=2, npoints=5)
#compute trajectories
trjfdc = psetdc.rk4flat(Lagrangian.interpf,numstep,coordinates='spherical')

## random sampling
# Argument "npoints" defines the number of particles inside the disk.
# If not defined default value is 1000.
# For illustration purposes here we only set 10 particles
psetdr = ParticleSet.from_disk(numdays,lonc,latc,rad,dayv,
                              sample='random',fieldset=field,mode='forward',npoints=10)
#compute trajectories
trjfdr = psetdr.rk4flat(Lagrangian.interpf,numstep,coordinates='spherical')
import numpy as np
import matplotlib.pyplot as plt

import cartopy.crs as ccrs
import cartopy.feature as cfeature
from cartopy.mpl.gridliner import LONGITUDE_FORMATTER, LATITUDE_FORMATTER
from matplotlib.ticker import MultipleLocator

extent = [2, 9, 40, 44]
proj = ccrs.Mercator()

fig, axes = plt.subplots(
    1, 2,
    figsize=(14, 6),
    subplot_kw=dict(projection=proj),
    constrained_layout=True,
)

titles = [
    "3) ParticleSet from_disk (circles)",
    "3) ParticleSet from_disk (random)",
]

traj_sets = [
    trjfdc,  # circles
    trjfdr,  # random
]

for ax, trjf_loc, title in zip(axes, traj_sets, titles):

    ax.set_extent(extent, crs=ccrs.PlateCarree())

    ax.add_feature(cfeature.LAND, facecolor="0.83", edgecolor="none", zorder=100)
    ax.add_feature(cfeature.COASTLINE, linewidth=0.8, zorder=101)

    gl = ax.gridlines(
        crs=ccrs.PlateCarree(),
        draw_labels=True,
        linewidth=0.5,
        linestyle="--",
        color="0.5",
    )
    gl.top_labels = False
    gl.right_labels = False
    gl.xformatter = LONGITUDE_FORMATTER
    gl.yformatter = LATITUDE_FORMATTER
    gl.xlocator = MultipleLocator(2)
    gl.ylocator = MultipleLocator(2)

    ax.quiver(
        X, Y, u0, v0,
        transform=ccrs.PlateCarree(),
        scale=5,
        color="k",
        zorder=1,
    )

    # --- Trajectories (NO reshaping, NO looping) ---
    trjx = np.asarray(trjf_loc["trjx"])
    trjy = np.asarray(trjf_loc["trjy"])

    ax.plot(
        trjx, trjy,
        transform=ccrs.PlateCarree(),
        zorder=102,
    )

    # Initial positions (red X)
    ax.plot(
        trjx[0], trjy[0],
        "rx",
        transform=ccrs.PlateCarree(),
        zorder=103,
    )

    # --- Circles ---
    a = np.linspace(0, 2 * np.pi, 100)

    # inner circle (only for "circles" case)
    if title.endswith("(circles)"):
        cx = lonc + np.cos(a) * 0.1
        cy = latc + np.sin(a) * 0.1
        ax.plot(cx, cy, "-", transform=ccrs.PlateCarree(), zorder=104)

    # outer circle (both cases)
    cx = lonc + np.cos(a) * rad
    cy = latc + np.sin(a) * rad
    ax.plot(cx, cy, "-", transform=ccrs.PlateCarree(), zorder=104)

    ax.set_title(title)

plt.show()